
Create charts online. Free. No sign-up.
Pick a type, paste your numbers, adjust colors and labels, download PNG or JPEG.
How it works
Pick a type, paste numbers, download a PNG.
1
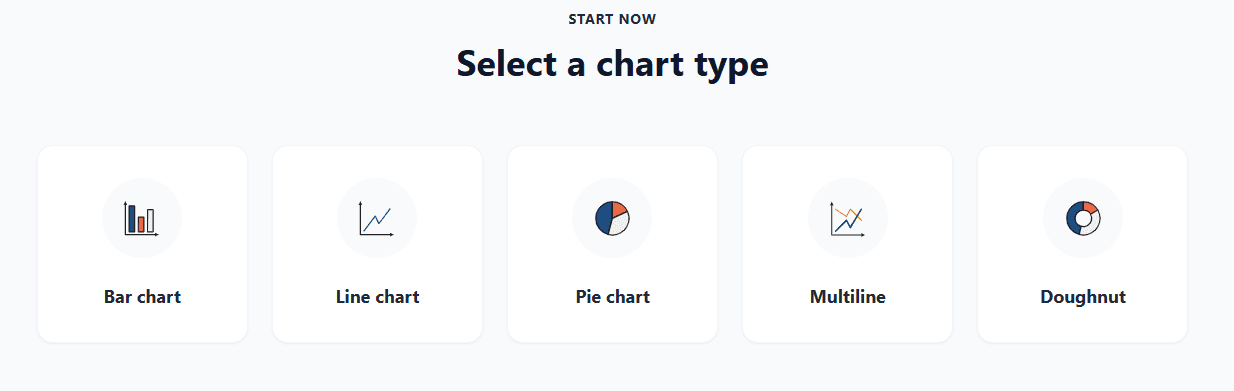
Choose a chart type
Bar for comparing groups, line for trends, pie or doughnut when showing share, multiline for several series.
2
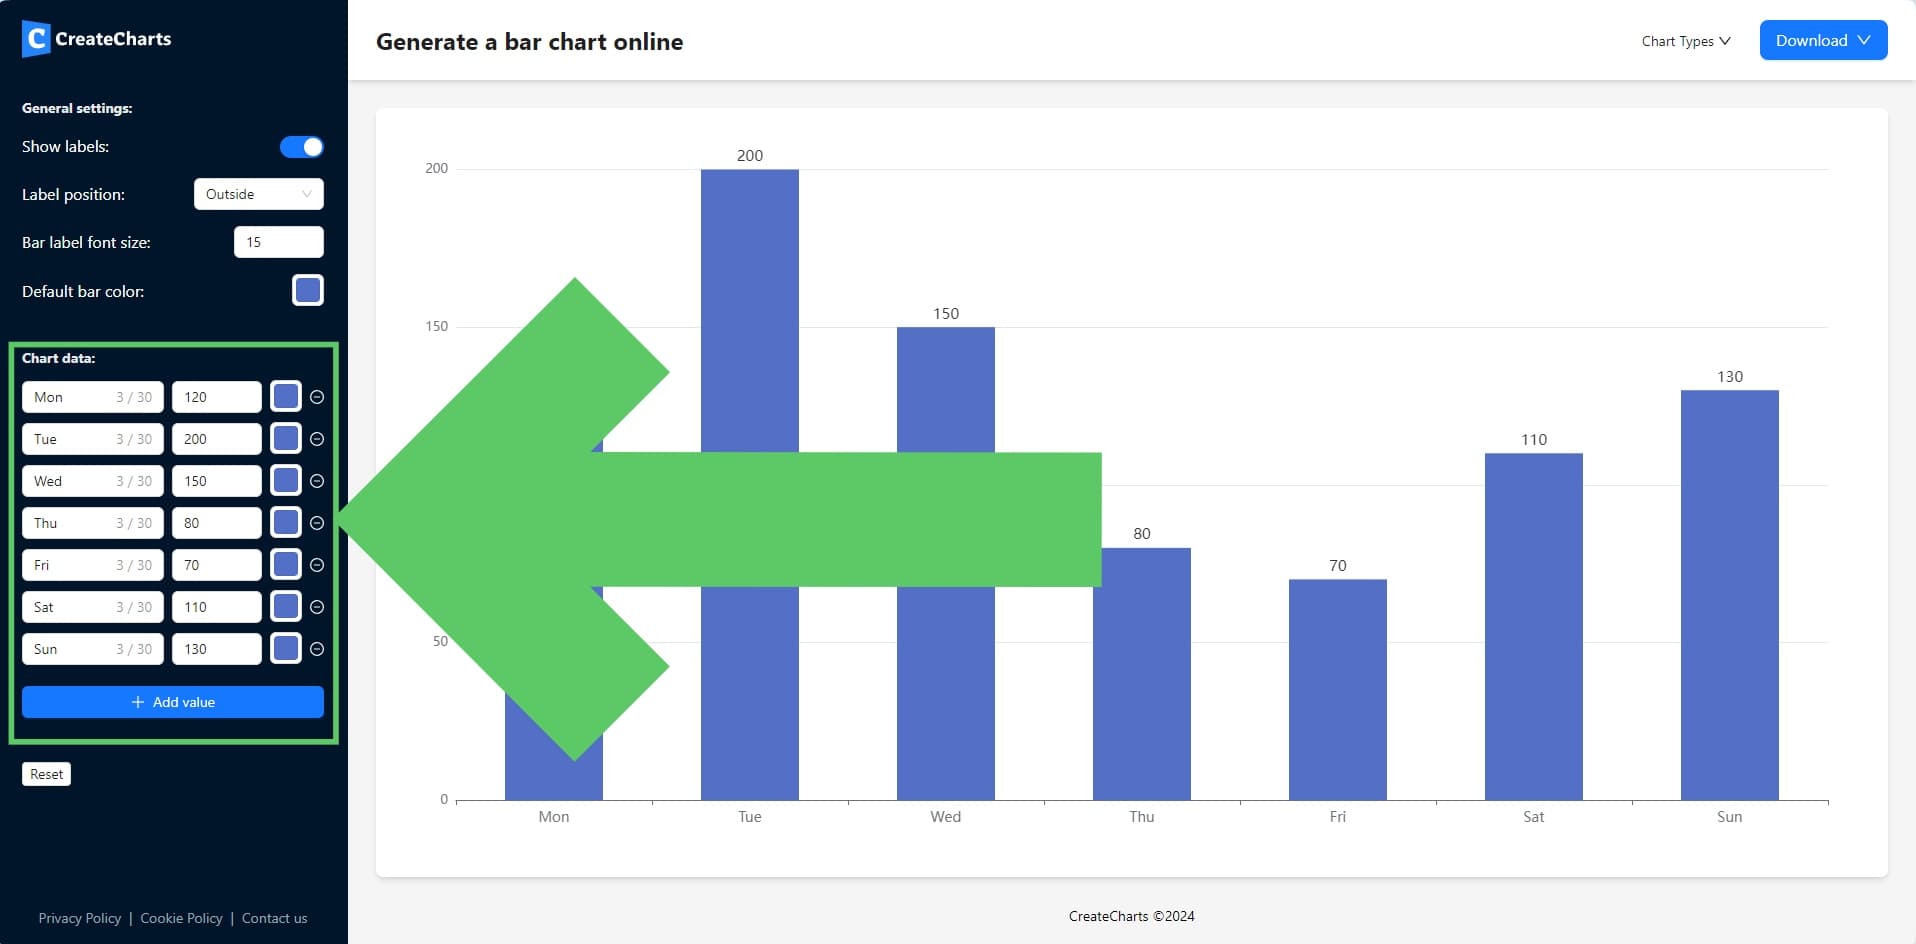
Enter your data
Type numbers directly or paste from a spreadsheet. Labels go in the first column, values in the next.
3
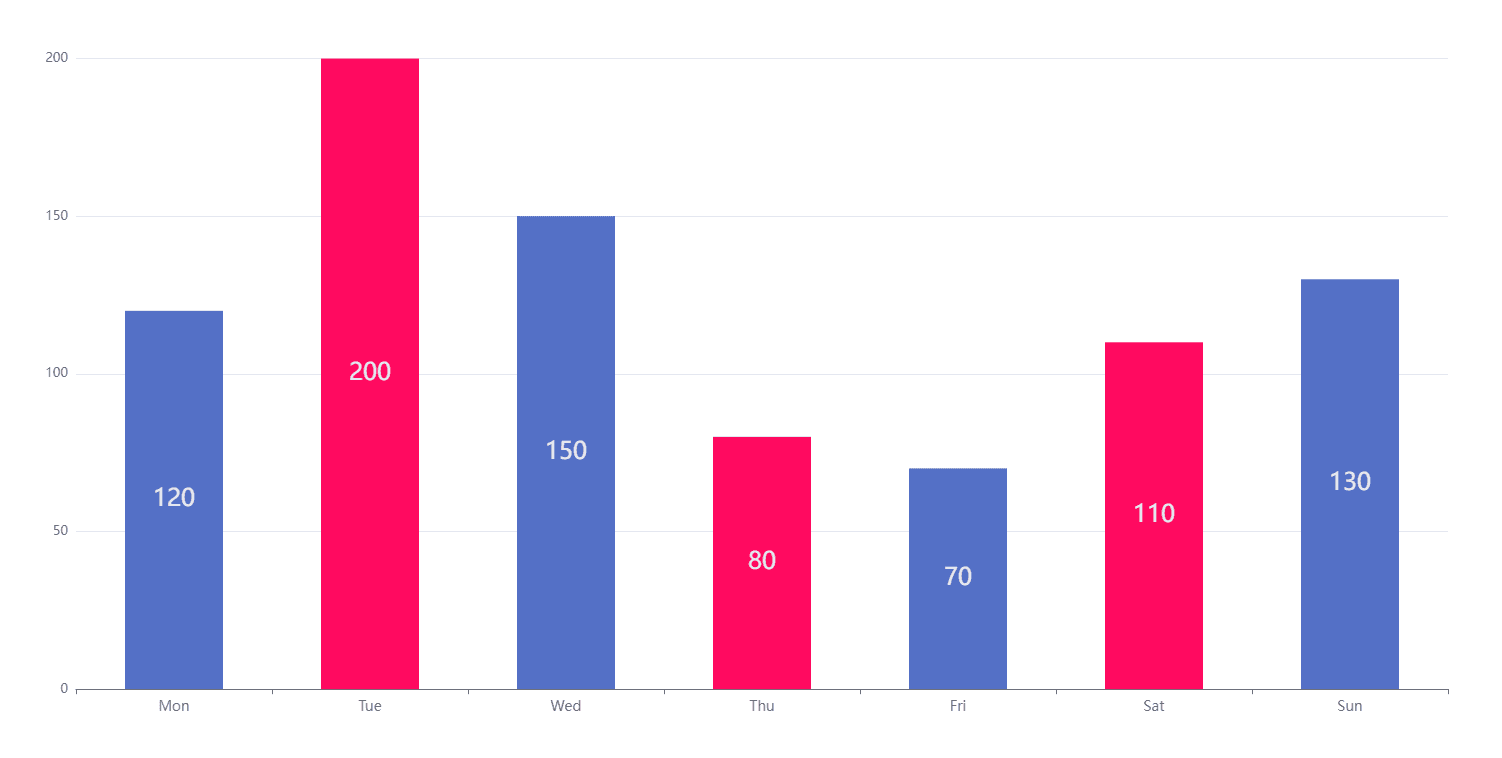
Adjust colors and labels
Change bar colors, font size, title, and gridlines. Controls sit beside the chart.
4
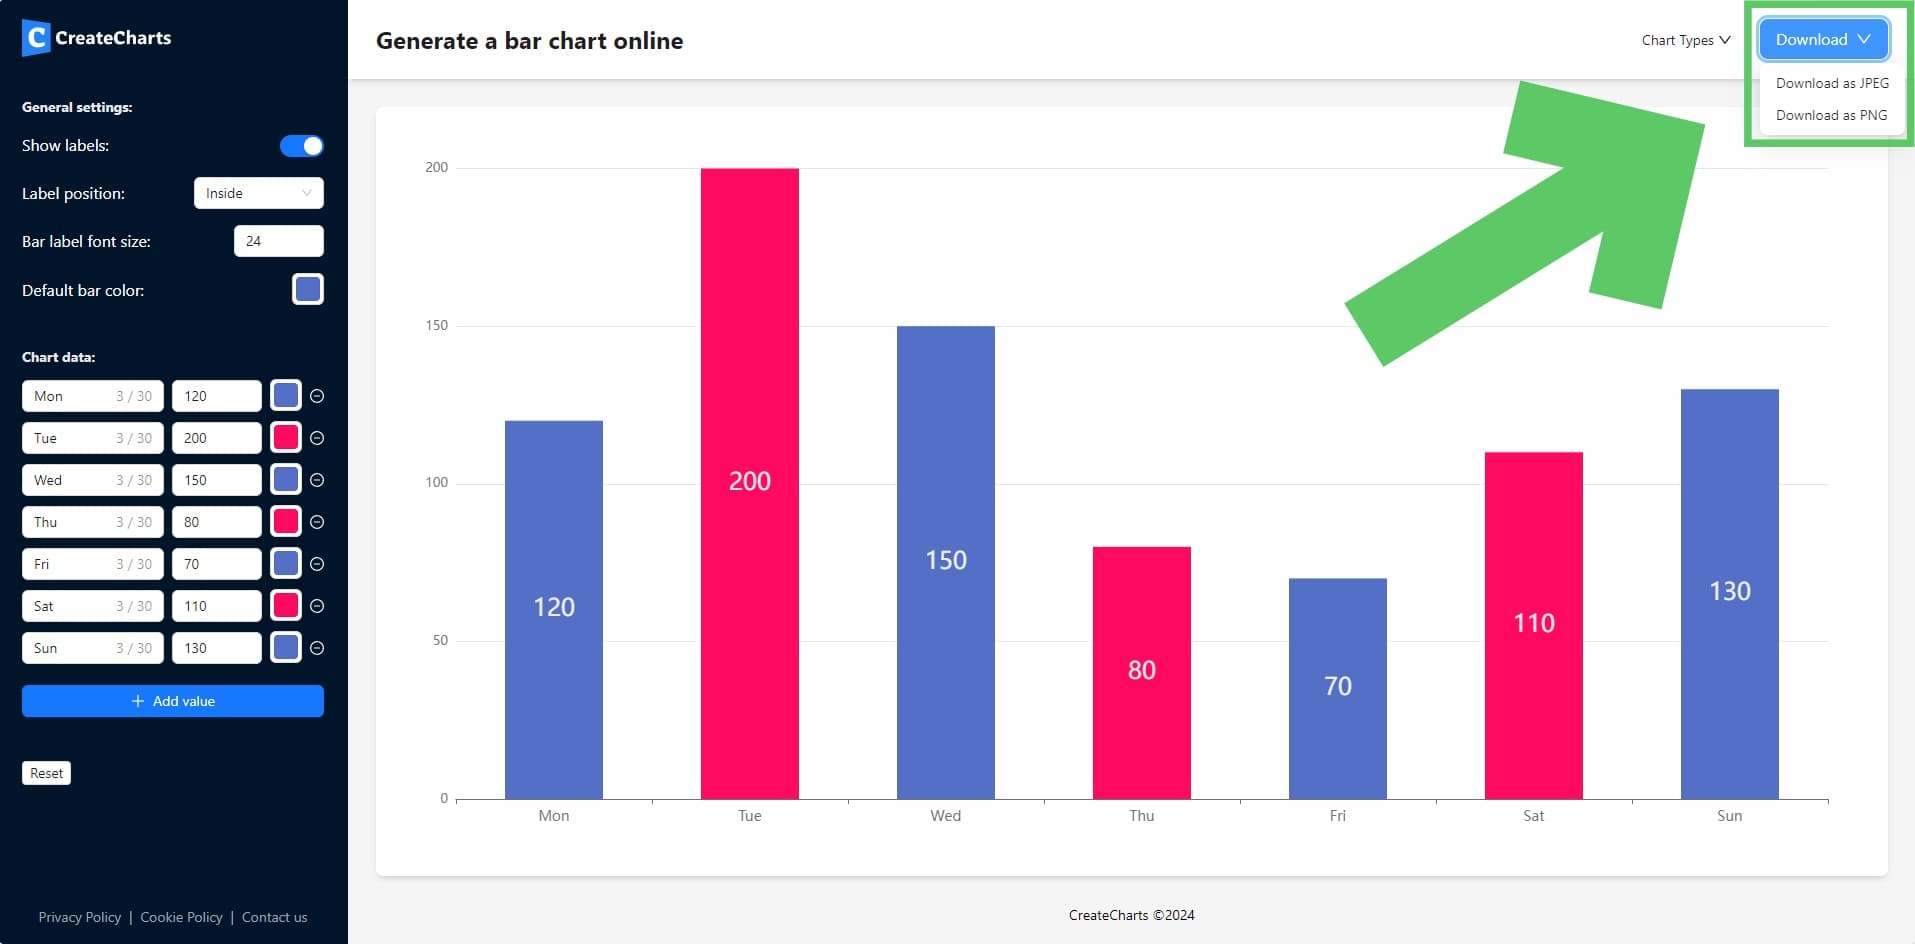
Download
Export PNG or JPEG. The file drops into your downloads folder, ready for a slide.
Choose a chart type
Pick the type that matches your data, then start building.



Why use CreateCharts
For people who need a clean graphic without opening Excel or installing design software.
No software to install
Works in any modern browser. Create unlimited charts and download immediately.
Live customization
Change colors, labels, fonts, and gridlines with a preview that updates as you type.
Ready in a minute
Paste numbers from a spreadsheet, pick a type, export PNG or JPEG for the slide.
Use bars to compare categories, lines for trends over time, and pie or doughnut charts when you are showing share of a whole. For two or more series on the same timeline, use multiline.
Chart types
Compare values across categories: sales, survey results, performance metrics.
Show trends over time: traffic, revenue, temperature.
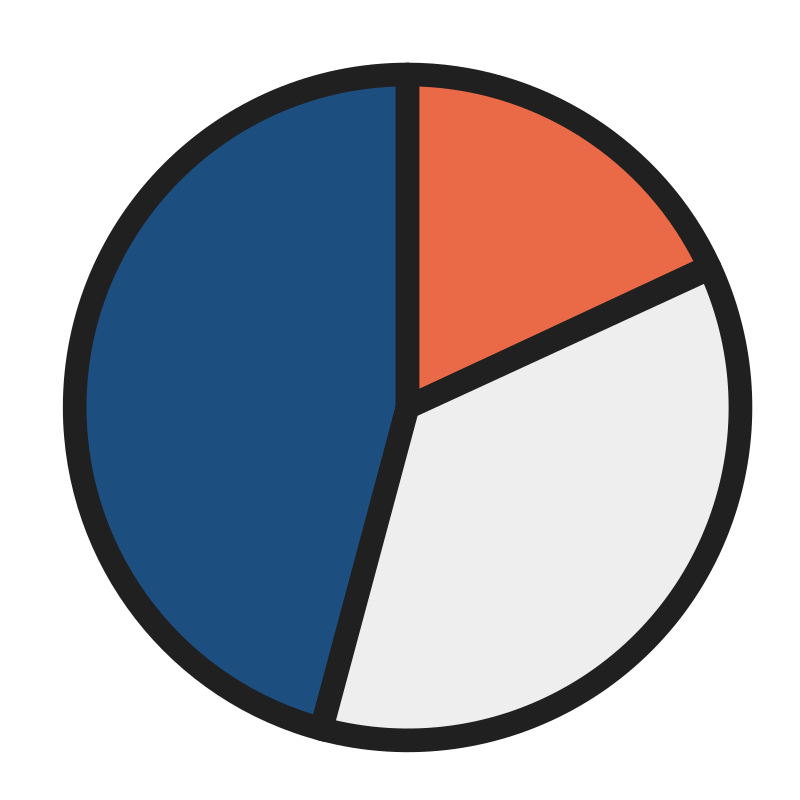
Show proportions of a whole. Best with a small number of categories (4–6).
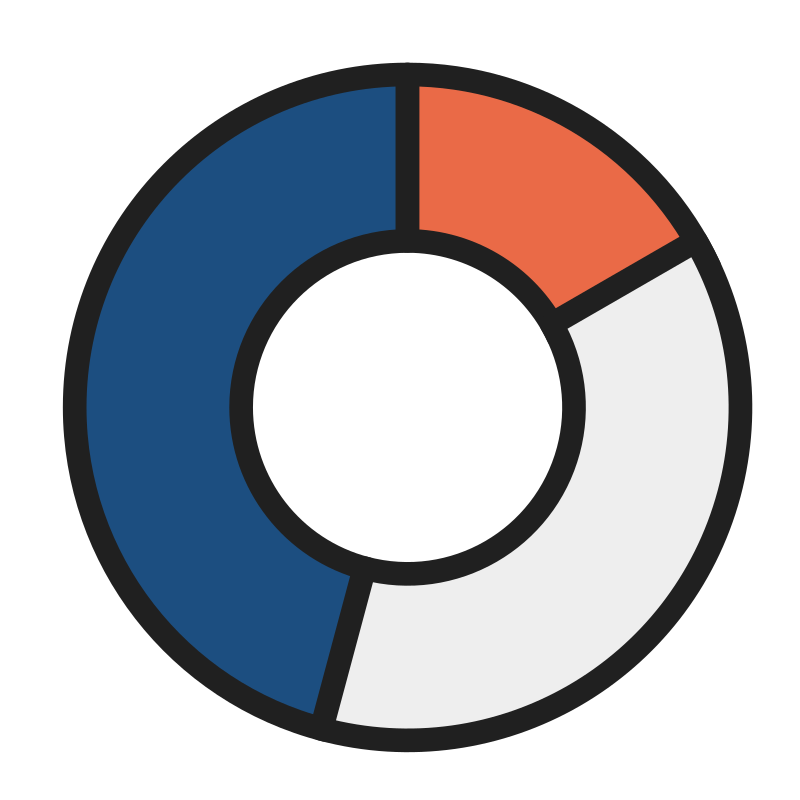
Same as pie, with space in the center for a label or total.
Compare multiple data series over the same time period.
Where people use it
Slides, reports, papers, and posts — anywhere you need a clean graphic from a few numbers.
Business reports
Quarterly reviews, KPIs, and stakeholder decks. Compare sales, performance, or budgets without opening a spreadsheet app.
School and research
Papers, dissertations, and class projects. Visualize survey results or measurements, then export a PNG for the document.
Marketing and social
Campaign results, mix, and share. A doughnut or bar chart that is ready to drop into a post or client report.
Browser chart tools skip licenses, installs, and updates. Open CreateCharts from a laptop or tablet, pick a type, and download PNG or JPEG when the chart looks right.
Common questions
Chart guides and how-tos
All articles
Jun 18, 2026 · 4 min read
How to Use Color in Data Visualization to Guide Your Audience
Use color to point at the story, not to decorate every bar. Palettes, highlight tricks, and color-blind pairing that still reads in gray.
Jun 18, 2026 · 4 min read
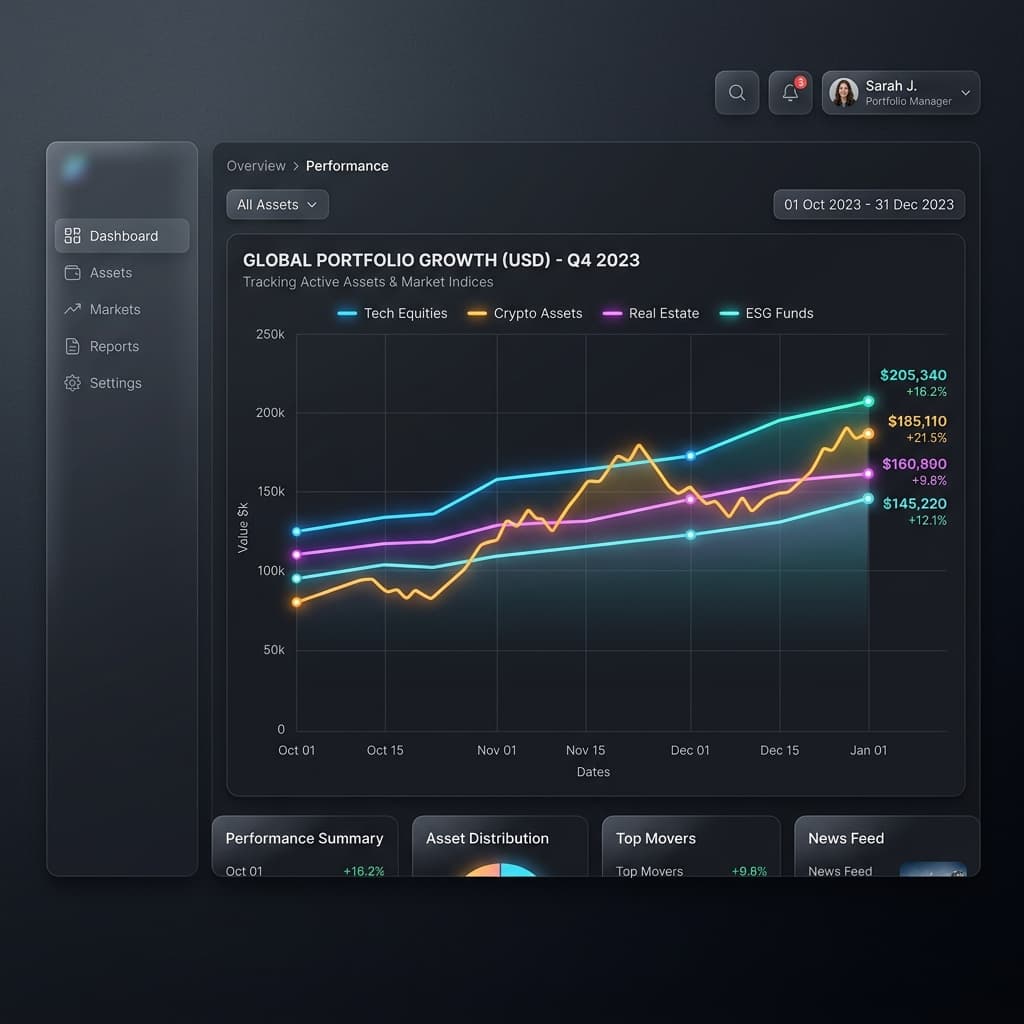
Mastering Multiline Charts: Visualizing Complex Trends Without Clutter
A multiline chart compares several trends on one time axis. Keep it to a few lines, label them on the chart, and skip the spaghetti.
Jun 18, 2026 · 5 min read
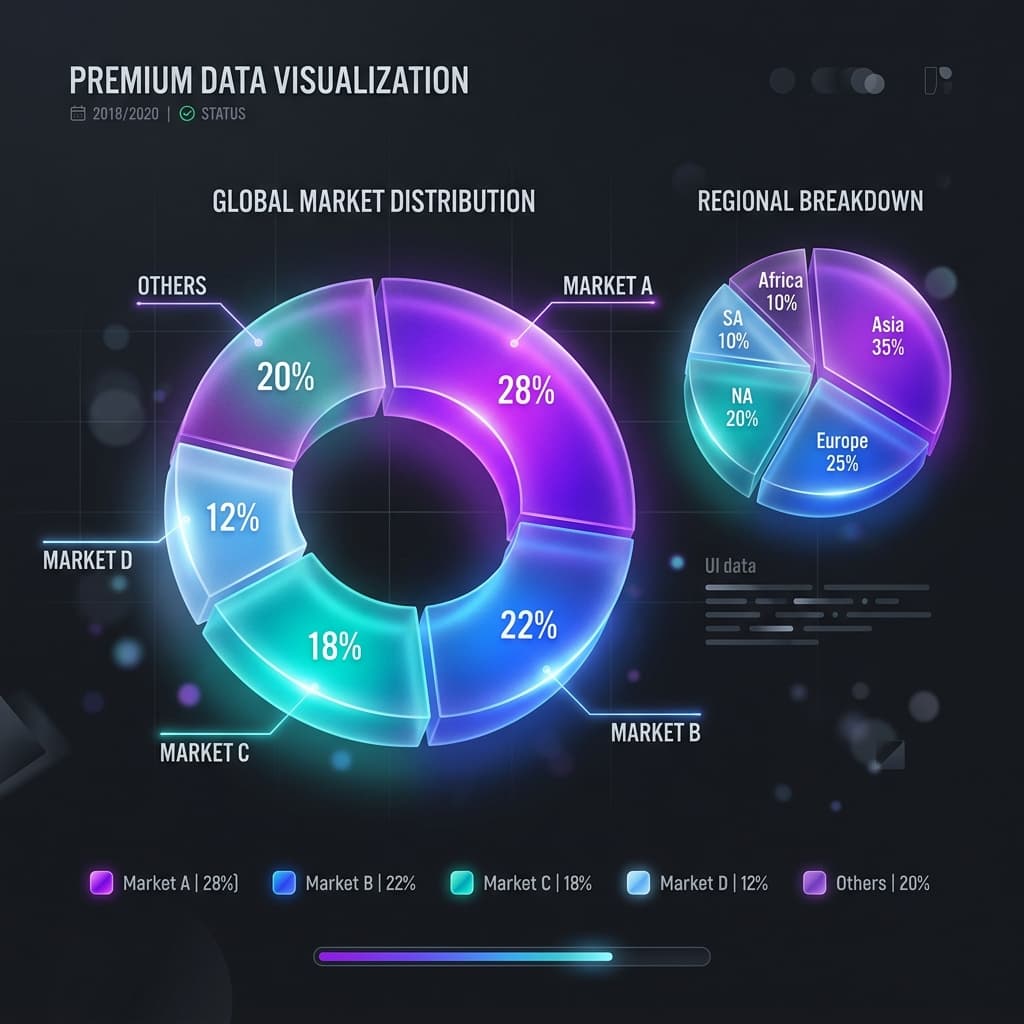
The Power of Pie and Doughnut Charts: When and How to Use Them
Pie and doughnut charts work when a few slices add up to 100%. Skip them when the parts are similar, many, or not a whole.